
Inside the Code Editor you'll edit four kinds of assets: Scripts and Utility which uses the Lua scripting language; Fragment Shader and Compute Shader which uses the current GLSL ES version set in your application profile. The Code Editor builtin inside the NRGeditor is specially designed for handling the different languages used internally by NRG; like Lua and GLSL ES. Featuring syntax highlight for both Lua and GLSL, functions drop down, debugging functionalities and make it easy to manage what's going on in your script and shaders. It also features "Intellisense" and code completion for all base functions and user functions, full-fledged debugger, mouse hovered variables debugging, builtin shader optimizer and a lot more.
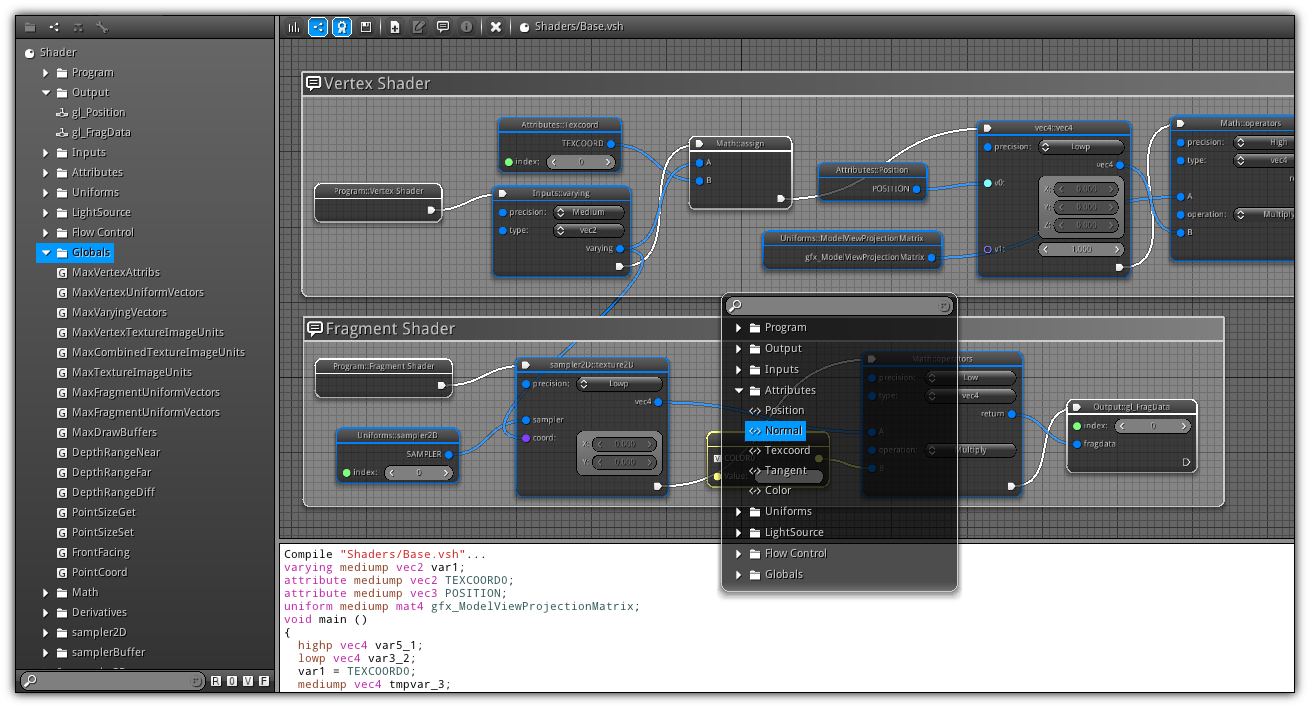
Technically the Code Editor is two editors rolled into one; depending on the type of work you are working on; you can choose to either use the editor for coding manually using the Code View mode; or the node editor using the Node View mode. Ideal for artists and non-programmers; in Node View you can fully create utilities, scripts and shaders using only nodes so you don't even have to touch a single line of code. You can toggle the editor mode at your convenience from the Menu. In addition, for programmers; you can even build your own custom nodes using the builtin node language to create visual resources for artists and non-programmers. Once created you can use them to create friendly node tree, share them among projects and even redistribute them for others to use.
Also, worth mentioning that external plugins are also fully supported. The source code that are using Lua (including nodes) can also have access to functions contained in .dll (dynamic link libraries) or a .so (shared objects). Plugins used by real-time applications are usually coded in C/C++ but; any other languages capable of outputting a .dll or .so is also an option.
| Mode | Icon | Shortcut | Description |
|---|---|---|---|
Code View | Alt+C | In code view the central area of the editor will display the source code of the asset you are working on. Inside the text editor you can access to all modern features found in other code editor including syntax highlighting, "Intellisense", code completion etc... | |
Node View | Alt+N | Select this mode to either code using nodes or create custom nodes. Once this mode activated the center part of the editor will display the node work board where you can create your scripts and shaders. |
Menu
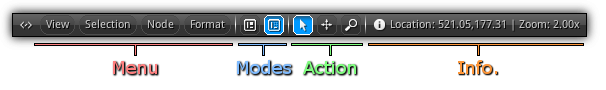
Menu: View control the different display options of the node editor. Selection allows you to manipulate node groups using the active node selection. The Node menu item contains utilities when manipulating nodes. The format is dedicated for manual code editing to indent and comment code.
Modes: Control the current code editor view mode; either Code View or Node View.
Action: The default action of the Left Button (or single touche) when using the node editor.
Info: Available in Node View; the information located on the top right of the toolbar displays the current grid offset position on the X and Y axis as well as the current zoom factor.
View Menu
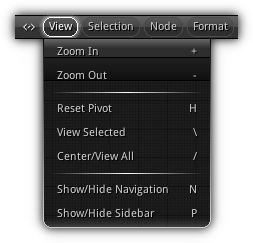
All viewing options are available in Node View as they apply only to nodes.
| Item | Shortcut | Action |
|---|---|---|
| Zoom In | + | Increase the central viewing distance of the node editor. |
| Zoom Out | - | Decrease the central viewing distance of the node editor. |
| Reset Pivot | H | Reset the graph location back to 0,0 and reset the viewing distance of the node editor. |
| View Selected | \ | Focus the active node. |
| Center/View All | / | Center the view to encapsulate all nodes currently visible inside the node editor. |
| Show/Hide Navigation | N | Toggle on/off the top right quick navigation control. |
| Show/Hide Sidebar | P | Toggle on/off the navigator sidebar. |
Selection Menu
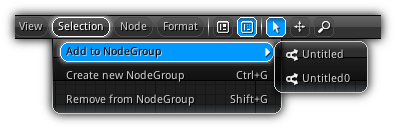
Same as for the View Menu; all functionalities apply only when the Code Editor is in Node View mode.
| Item | Shortcut | Action |
|---|---|---|
| Add to NodeGroup | Append the active node selection to an existing node group. | |
| Create new NodeGroup | Ctrl+G | Create a new node group using all selected nodes (if any). If a selected node is already part of another group it will be transferred to the new one automatically. |
| Remove from NodeGroup | Shift+G | Remove all selected node from their existing node group (if any). |
Node Menu
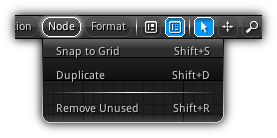
Contains node specific utilities.
| Item | Shortcut | Action |
|---|---|---|
| Snap to Grid | Shift+S | Tidy up node placement by snapping them to the nearest grid line. |
| Duplicate | Shift+D | Duplicate the active node selection. |
| Remove Unused | Shift+R | Remove all nodes that are currently not connected to any sockets of the existing node tree. |
Format Menu
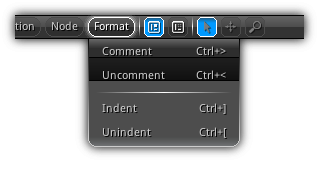
Available only while manually editing code in Code View.
| Item | Shortcut | Action |
|---|---|---|
| Comment | Ctrl+> | Comment the active line selection within the active code textarea. |
| Uncomment | Ctrl+< | Uncomment all selected lines starting with a comment identifier within the active code textarea. |
| Indent | Ctrl+] | Add extra tab to all lines currently selected in the code textarea. |
| Unindent | Ctrl+[ | Remove an extra tab to all selected line within the active code textarea. |
Action
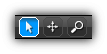
The different control mode listed below is available when the Code Editor mode is set to Node View. These options control the default behavior of the Left Button while operating on the node grid.
| Icon | Mode | Shortcut | Description |
|---|---|---|---|

| Selection | Use this mode to single or multi-select nodes and comments located on the node grid graph of the current node tree. | |

| Pan | Shift+Alt+Left Button | Pan the node grid. Alternatively to jump directly to a specific location on the grid all you have to do is to double tap it. |

| Zoom | Ctrl+Alt+Left Button | Zoom in/out the node grid scaling the current node tree. In addition, similar to other area (ie) like the 3d viewport you can zoom in/out by using your mouse scroll. |
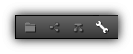
Sidebar
Located on the left side of the editor the sidebar contains four distinct elements that can be toggled at all time. Depending on the current state and view of the editor functionalities will be enabled or disabled. Refer to the table below to learn how to get the most out of every function.
| Item | Description |
|---|---|
| The folder icons toggle the navigator tree view which let you browse your project architecture for scripts, utilities and shaders. | |
| Available when a "scriptable" asset is using nodes; toggle this item to bring up the node browser. All available for the current type of asset you are working on will be listed. | |
| When Ldb (the Lua debugger) is activated (either locally or remotely) and a script or utility hit a breakpoint (or when an exception occur) the call stack will be available in this section allowing you to inspect variables in order to debug your scripted assets. | |
| When editing code manually using the source code editor; the property panel gives you access to search functionalities as well as options to adjust the visual display and properties of the editor. | |
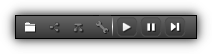
| Start increasing the application playback time; press again to stop and reset it back to 0. | |
| Pause the playback. | |
| Increase the time step of one frame (see Playback Controls to setup a specific or relative frame time). |
Navigator
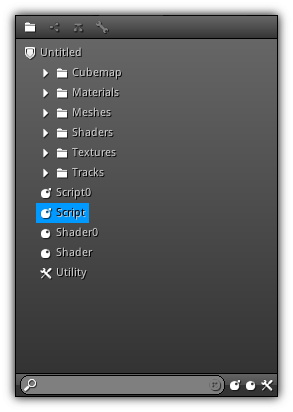
The navigator displays a tree view showing only the assets that require code and that can be edited with the Code Editor. To start coding or start building/editing a node tree simply click on an asset name using the asset state the interface will either display the Code View or Node View (if the asset is using nodes).
Located at the bottom of the panel you can find the quick search functionalities; to search a specific asset by its name or partial just type in and the results will be highlighted. To filter your search to a specific asset type click on the toggle buttons located on the right of the search box. Only the asset types that are enabled will be displayed within the tree view.
- Note
- To quickly assign an asset to an existing property of the same asset type; simply drag and drop it on top of the text box.
Node Browser
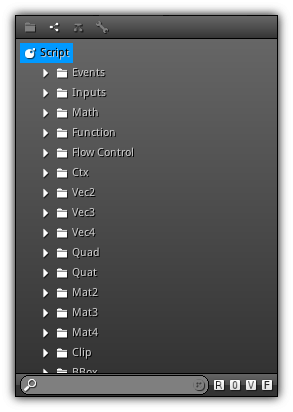
When an asset has been set to use nodes instead of raw code; this section of the sidebar will display all the node catalogs available for that type of asset. Expand a catalog by clicking on the side arrow to reveal all the nodes blocks available. To add and place a new node block on the node grid simply double click/tap on its name.
At the bottom of the node browser, a quick search is also available. You can search node block names by type a substring and all nodes blocks containing it will be highlighted. To restrict and filter nodes you can use the toggle button located on the left side of the quick search.
| Symbol | Description |
|---|---|
R | Include all root nodes. |
O | Include all output nodes. |
V | Include all variable nodes. |
F | Include all nodes that are associated to a function. |
Callstack
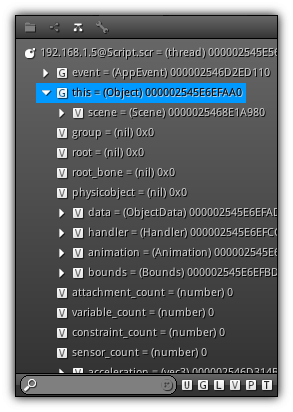
The debugger (Ldb) will be triggered automatically when a user breakpoint or an exception is triggered either locally or when debugging remotely on another device using the NRGclient. The call stack gives you vital information about the current state of the virtual machine for the specific coroutine that is being debugged. To expand the call stack and inspect variables simply click on the arrow of the different variables available.
The quick search at the bottom of the call stack tree view lets you search by string or sub-string elements contained in all the tree. To refine your search to a specific type of variable use the toggle buttons located on the right of the text box.
| Symbol | Description |
|---|---|
U | Includes all up values. |
G | Filter global variables. |
L | Show/Hide local variables (adjusted automatically using the current stack). |
V | List all variables values. |
P | Remove all null pointers from the callstack; only display values and assigned memory addresses. |
T | Include all temporary values; only recommended for expert users that are trying to optimize the local call stack of a function; otherwise it is recommended to leave this one off; if you need more speed (and flexibility) use a C/C++ plugin. |
Properties
Available when using the Code Editor for manual coding using the Code View; using this section of the sidebar you have access to basic find and replace functionalities and can tweak visual properties of the text editor.
Search
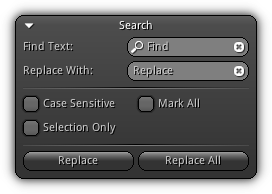
Find Text: The text to find.
Replace With: The text to replace the find string with.
Case Sensitive: Force the search to be case-sensitive.
Mark All: Highlight all occurrences of the text to find in the source code.
Selection Only: Only replace text within the current line selection (if any).
Replace: Replace the first highlighted occurrence.
Replace All: Replace all occurrence of the text to find with the text to replace with.
Text Editor
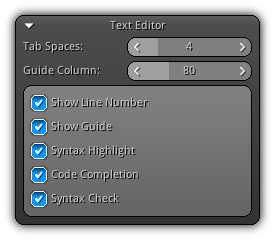
Tab Spaces: How many spaces a tab should be equivalent to.
Guide Column: Amounts of character to use when placing the guide at a specific amount of characters. This allows you to keep your code straight and aligned to a specific margin.
Show Line Number: Add an extra column on the right side of the text editor showing the line number.
Show Guide: Show/hide the code guide (also see Guide Column).
Syntax Highlight: Allow detecting and display color based syntax highlight depending on the type of language the text editor is using.
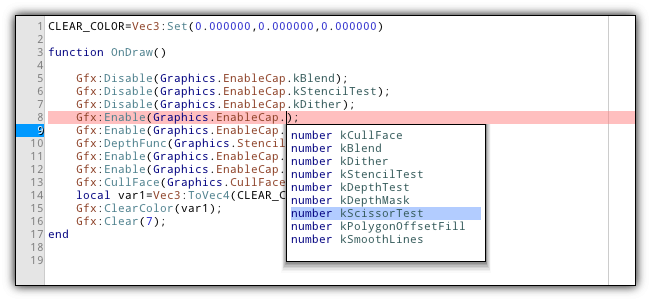
Code Completion: Enable/disable code completion functionalities. If enabled when a line of code is unfinished; or when a : or . is encountered and you pause typing a code completion list will appear.
Syntax Check: Parse the source code live before compilation to detect possible syntax errors.
- Note
- If this option is turned on and an error is found; details will be be displayed in the Output Log area.
Code Area
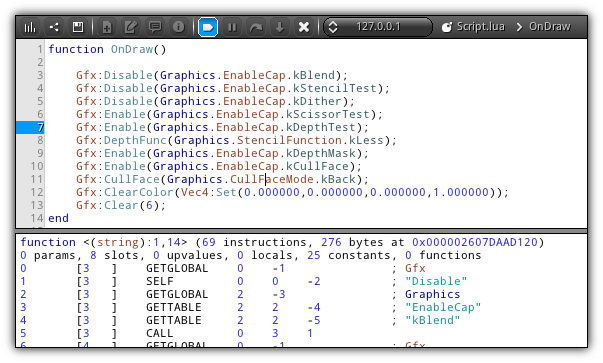
On the right of the sidebar is the code working area where either source code or nodes are displayed. The area is divided into three parts. At the top is the toolbar that contains shortcuts to perform a common operation based on the type of mode and asset you are working with.
The center part is dedicated to source code and node editing, by changing the Code Editor mode this is the area that will switch between the Code View and the Node View.
At the bottom it's the output log; this is where you can monitor different compiler (Lua and GLSL) output messages of the type of asset you are dealing with.
Toolbar
| Icon | Action | Shortcut | Description |
|---|---|---|---|
| Build | Ctrl+B | Build the current asset using the appropriate compiler for the type you are working on and update its binary code.
| |
| Activate Nodes | Enable/disable the use of nodes for the current asset. When toggling this option off; if you already have some code generated the code will still be available and will not be deleted. You can continue to work on the code right where you left off while using nodes. | ||
| Optimize | Available for shaders only; the built-in optimizer will automatically use your code and run multiple optimization pass; the resulting code will be use when compiling the shader on GPU. | ||
| Save | Ctrl+Shift+S | Save the current asset code / nodes. | |
| New Nodeblock | Display the New Nodeblock dialog allowing you to create a brand new custom node. | ||
| Edit Nodeblock | Display the Edit Nodeblock dialog and load the code of the active node block. If the node block is a user node block the code can be edited, if it is a builtin node block the code will be set to read-only. | ||
| New Node Comment | Create a new node comment. | ||
| Node Variable Info. | If the active node selected is a variable node; clicking on this icon will open the Variable Settings dialog allowing you to set the default value and range for the variable that will be use when the asset is assigned to a resource. | ||
| Toggle Breakpoint | Enable or disable all breakpoints set in your source code and/or nodes for the specific asset currently in edit mode. Disabling breakpoints will not remove them; they are simply going to be ignored by the debugger for this specific asset (Lua code specific only). | ||
| Continue | Available when the debugger (Ldb) hit a breakpoint; pressing this button will continue the script execution. | ||

| Stop | Stop the utility script execution. | |
| Step Over | When Ldb break pressing this button will force the script to execute and step over to the next line. | ||
| Step Into | If the line you are currently debugging contain a function call this action will force the execution to enter the code of the function. If no function is available at the line where the debugger break this action will result as a step over. | ||
| Startup | Available when a utility; pressing this button will automatically move the selected util debugging multiple device simultaneously a break point placed inside the utility is not already place in the startup group. Once placed in that folder your utility will automatically run when your project is loaded/reloaded in the editor. | ||
| Close | Stop editing the current asset and remove the link to the code editor. Releasing the link with the asset will allow you to delete it (if no other link exists). |
Address Box

When debugging multiple devices simultaneously, if a breakpoint is placed inside a script, it might hit on more than one device. This combo box allows you to select the call stack of which device you want to display. By default; it is set to point to the local host address which represents a loop back to the editor server itself (127.0.0.1).
Function Jump
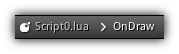
When the Syntax Check option of the text editor is enabled every time the code is parsed for error and none are found a list of the available functions contained in your code will be refreshed. Clicking on the arrow located on the right side of the source, the filename will display the available function list; to jump directly to a function simply select it from the list by tapping.
- Note
- When editing a
Fragment Shaderasset; clicking on the source filename will allow you to switch between theVertexandFragmentsource file; or alternatively, you can use theShift+Tabshortcut to swap from one source file to the other.
Code View
In Code View the text editor is dedicated to source code editing. Based on the asset currently in edit mode the compiler to use will automatically be selected. Even when working with nodes, using the Node View you can still go back to Code View to inspect the code generated by the node tree (the code will be set to read-only).
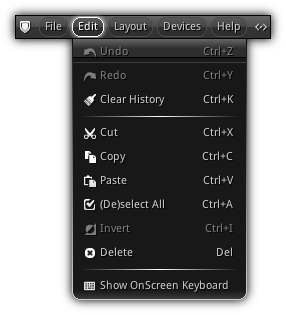
Edit
| Item | Shortcut | Action |
|---|---|---|
| Cut | Ctrl+X | Delete the current text selection and store the selected string into the clipboard. |
| Copy | Ctrl+C | Copy the text selection to the clipboard. |
| Paste | Ctrl+V | Paste the clipboard text content (if any) to the text editor. |
| (De)select All | Ctrl+A | Select/de select all the text. |
| Delete | Del | Delete the current text selection. |
Code Completion
Code completion is also embedded for the language that you are using, all you have to do is simply type in your code and stop for a second to pop the list. The list will appear at the line you are in the editor which is dimmed to be incomplete or when the text processor encounter a trigger (including . or :). The code completion will parse and analyze the syntax of your instruction and pop up a list with the most appropriate results to complete your code.
Setting Breakpoints
To set a breakpoint in your code (when editing a Script or a Utility which uses the Lua scripting language) all you have to do is to click on the line number where you want the debugger (Ldb) to break. When the execution of the Lua code reach that line it will stop and pull up the call stack.
Inspecting Variables
Once your code is being debugged to quickly inspect a variable all you have to do is to select it from your source then hold Ctrl+Shift which will highlight in the call stack the variable at the different stage of the executing (if more than one) allowing you to inspect its value.
Node View
In Node View the Code Editor is transformed into a node editor; in this mode, you can code entirely using nodes. To get started with a new node tree the first step is to insert at least one root node. Root node can be either an event for a script or an entry point (void main()) for shaders and function Register() for utilities.
Once a root node inserted select nodes using the Node Browser or push Spacebar anywhere on the grid to pop up the node list. Use the Action to move around the grid adding node and connecting them. Contrarily as manual source code editing where you have to build manually every time you make changes; using nodes you do not have to recompile manually, as soon a change is detected the code will be regenerated automatically and recompiled.
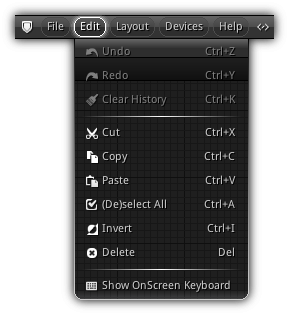
Edit
| Item | Shortcut | Action |
|---|---|---|
| Cut | Ctrl+X | Delete the current node selection and store the necessary script to reconstruct them into the clipboard. |
| Copy | Ctrl+C | Generate the scripting command to reproduce the current node selection. |
| Paste | Ctrl+V | Paste only if the clipboard content contains existing nodes generated from the code editor (using the copy/cut command). |
| (De)select All | Ctrl+A | Select all nodes from the node editor. |
| Invert | Ctrl+I | Invert the current node selection. |
| Delete | Del | Delete the current node selection. |
Navigation
Present at the top right side of the Node View is the navigation controller; this graph gives you an overall view of your node tree. As you node tree become more and more complex you can use this control to quickly jump from one location to another by simply clicking the location where you want to go.
Node Priorities
All programs entry point(s) nodes (root nodes and custom function nodes) have a ![]() and
and ![]() sign located at the top right of the node. These allow you to increase or decrease the priority of the declaration. Since both Lua and GLSL doesn't have a header files its important that the function that you are trying to call have already been defined. This feature allows you to manually manage the declaration sequence of each function including event callbacks and user-defined ones.
sign located at the top right of the node. These allow you to increase or decrease the priority of the declaration. Since both Lua and GLSL doesn't have a header files its important that the function that you are trying to call have already been defined. This feature allows you to manually manage the declaration sequence of each function including event callbacks and user-defined ones.
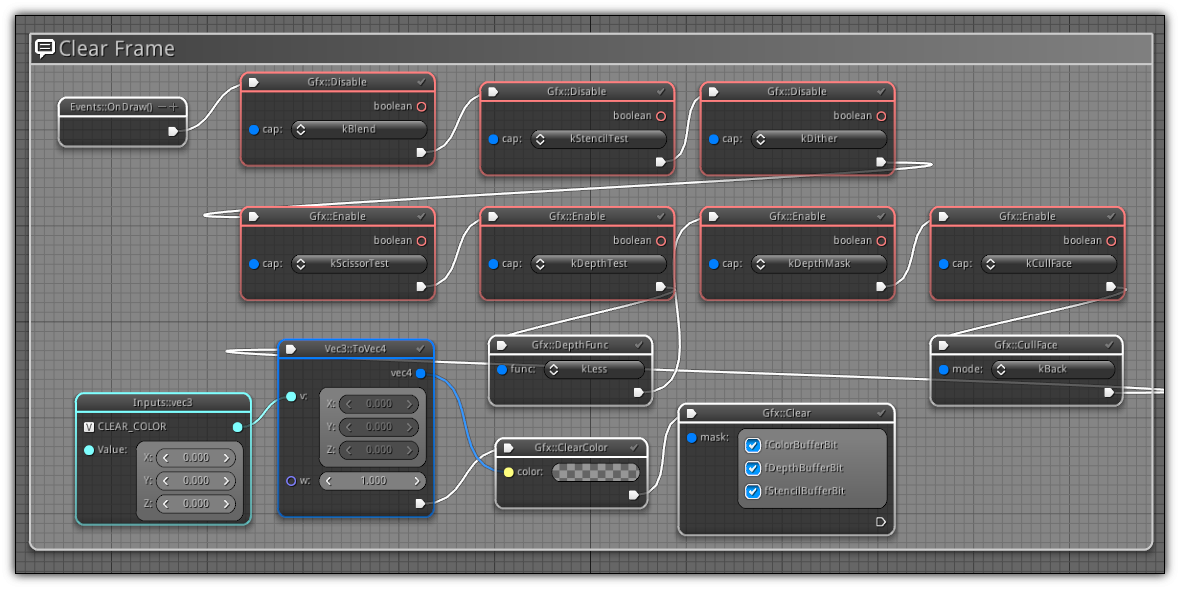
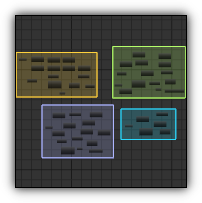
Node Comments
As your node tree grow, it is good practice to encapsulate nodes within a Node Comment. A node comment is a user defined box where you can drop node; they are not to be confused with NodeGroups which allows you to select all at once a predefined group of nodes that can be selected all at once using Ctrl+Left Button. At the top of the box of a Node Comments you have access to label that can be used to either give instructions on how to use the encapsulated block or can be used to determine what the block of node exactly do (ie.) just like in the screenshot above; the resulting code of the result in cleaning the screen.
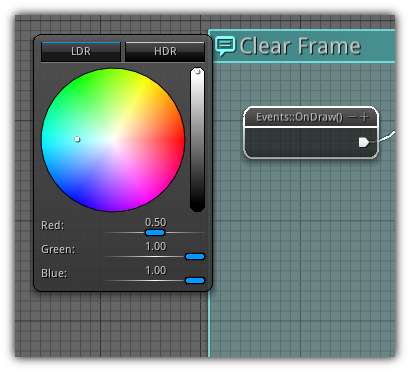
To create a node comment you can either use the toolbar New Node Comment button or within the node grid press Ctrl and draw a selection rectangle. Once created you can move all nodes contained within the rectangle by holding the Ctrl key; which will automatically select all node within the node comment area. To customize the node comment color click the ![]() icon to pop up the color picker.
icon to pop up the color picker.
Setting Breakpoints
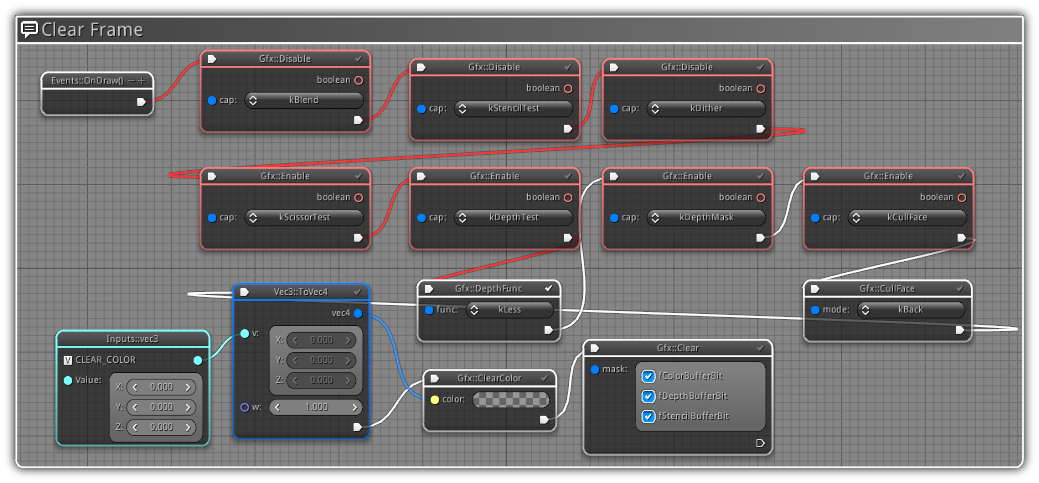
To set a breakpoint to the code line occupied by a specific node all you have to do is to click the ![]() icon located at the top right of a "debuggable" node (non-root or variable). This action will automatically set a breakpoint at the line where the node function call is located. While debugging, you will get a visual trace (connection highlighted in red) of the code path used to reach that node. Even if you are using nodes to debug you can still use all regular debugging operations such step over, which will bring you to the next node, step into to the root of the function call node etc...
icon located at the top right of a "debuggable" node (non-root or variable). This action will automatically set a breakpoint at the line where the node function call is located. While debugging, you will get a visual trace (connection highlighted in red) of the code path used to reach that node. Even if you are using nodes to debug you can still use all regular debugging operations such step over, which will bring you to the next node, step into to the root of the function call node etc...
Output Log
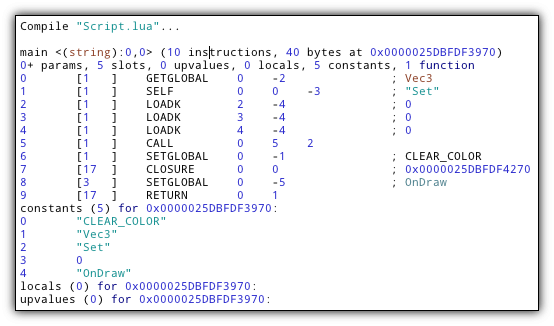
Located at the bottom of the Code Area is the output log; it is used to display compiler output messages; code parsing errors, runtime exceptions and allow you to review Lua Virtual Machine opcodes; as well as shader optimized code and build statistics.
Custom Nodes
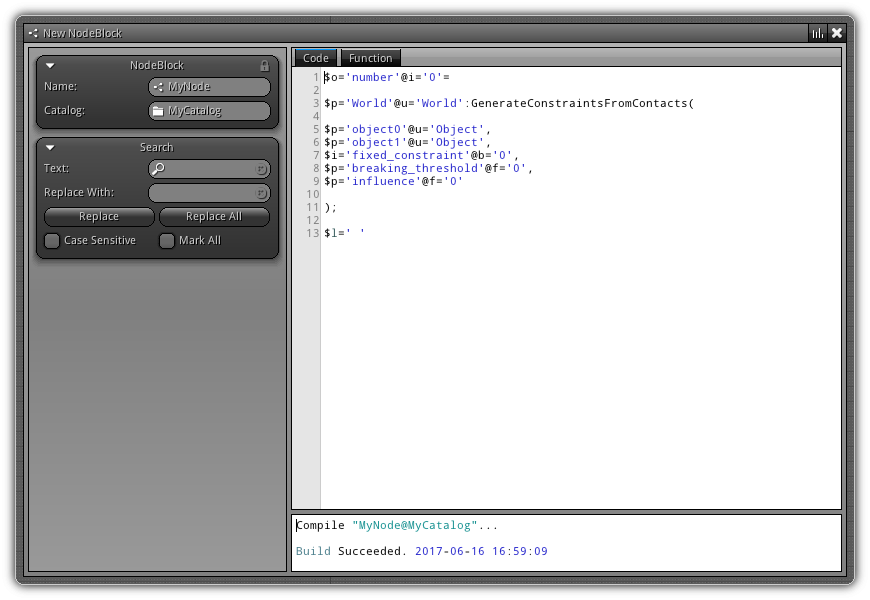
To create a new custom node click the ![]() icon located on the Code Area Toolbar this action will display the custom node editor. In this editor your code will be a mix of the Node Definition Tags and the programming language associated with the asset your custom node is targeting (Scripts and Utilities are using Lua and GLSL for Shaders).
icon located on the Code Area Toolbar this action will display the custom node editor. In this editor your code will be a mix of the Node Definition Tags and the programming language associated with the asset your custom node is targeting (Scripts and Utilities are using Lua and GLSL for Shaders).
Using the combination of both languages you will create customized node blocks ready to be integrated into a node tree. To edit an existing custom node block or review the code of an auto-generated one click the ![]() icon which will show the
icon which will show the Edit NodeBlock to either edit your existing node code or review the auto-generated code of a default node created by the editor. Reviewing auto generated code can be of great help while learning how to manually create your own nodes.
NodeBlock
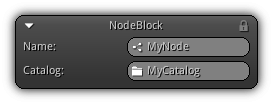
Name: The unique name to use for your custom node.
Catalog: Where to place your node block. This field can either be an existing catalog that you can manually input, or you tap the ![]() to list all predefined catalogs available. If the name you input is not an existing catalog a new one will be automatically generated for you.
to list all predefined catalogs available. If the name you input is not an existing catalog a new one will be automatically generated for you.
Search
Allow you to find and replace text either in the node block code or inside your custom function code. Refer to Sidebar > Properties > Search for more details information about each functionalities.
Code Area
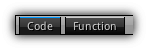
The right side of the dialog is the coding area; it is divided into two sections (up and down) in a similar fashion as the Code View. The upper part contains two tabs, one to input your custom node code and the second one is to input the custom function that your node will call.
At the bottom, it's the node generator output log. To compile your node you can either press the  button located at the upright of the dialog or press
 Ctrl+B. If your node tags contain errors they will be reported in the log area, and the line(s) will be highlighted within your node code. To learn how to code custom nodes look for Node Definition Tags in the Scripting API.
|
|